How it works · Sources and method
Sources and method
Where every number comes from, and what is seen by satellite and what is a computer estimate.
| Source | Used for | Kind |
|---|---|---|
| Sentinel-2 photo satellites (European Space Agency, Copernicus), haze-corrected photos from Microsoft Planetary Computer | Satellite photos in 10 m squares, map tiles 44QQF and 44QQG. Greenness, water scores and cloud removal. | Seen by satellite |
| ESA WorldCover 2021 land-use map | Labels each 10 m square. Only squares labelled crop fields count towards the plot crop numbers. Water and trees are left out. | Map (2021) |
| ISRIC SoilGrids 2.0 world soil map | Soil predictions on 250 m squares: sand, silt and clay, pH, organic matter, nitrogen, nutrient-holding power and packing. Read from ISRIC's public files, because its online service was down. | Estimate |
| NASA POWER daily weather | Rain, temperature, humidity, sunshine and deep-soil wetness, on a grid about 50 km wide. | Estimate |
| Open-Meteo historical weather | Rain, water pulled out by sun and wind, and soil wetness, rebuilt by computer. | Estimate |
| Esri World Imagery | Close-up aerial photos used to line up the marked screenshots and shown under the plot outlines (Esri, Maxar, Earthstar Geographics). | Photos |
| OpenStreetMap | Roads, river and village points used to check locations. | Map |
| Census of India 2011 and the government village list, via Odiapedia | Population, households, area and land use for Nilabadi. | Official (2011) |
How
How the numbers are made
- The plots. Outlines were traced from the map screenshots on which you marked the fields. There are two fields near the fishing pond (1.04 ha (2.6 acres) and 0.47 ha (1.16 acres)). There is one block north of the road, opposite the Agnigangamma Temple (7.47 ha (18.5 acres)). Each screenshot was lined up with close-up aerial photos by matching roads, ponds and tree clumps, to within about 1–2 m. The pond fields follow the bunds you can see. The temple outline follows the hand-drawn ring, kept 4 m back from the road. They are not surveyed boundaries.
- Crop greenness. FarmBot uses every cloud-free satellite photo from 1 Oct 2025 to 23 Oct 2026. For each one it takes the middle greenness score of the 10 m squares whose centre is inside each outline. Squares that the land-use map labels trees, buildings or water are dropped. A photo only counts when at least 60% of those squares are clear of cloud. The values are then smoothed. From the smoothed line FarmBot reads the greenest point, the dates it fell below 0.7 and 0.5, the dry-season low, and the half-way green date.
- Pond water. Squares within 150 m of the pond centre where either water score is above 0 count as water, and are added up in hectares. For this, only cloud, shadow and snow are removed, because the satellite's own labels wrongly call this pond soil.
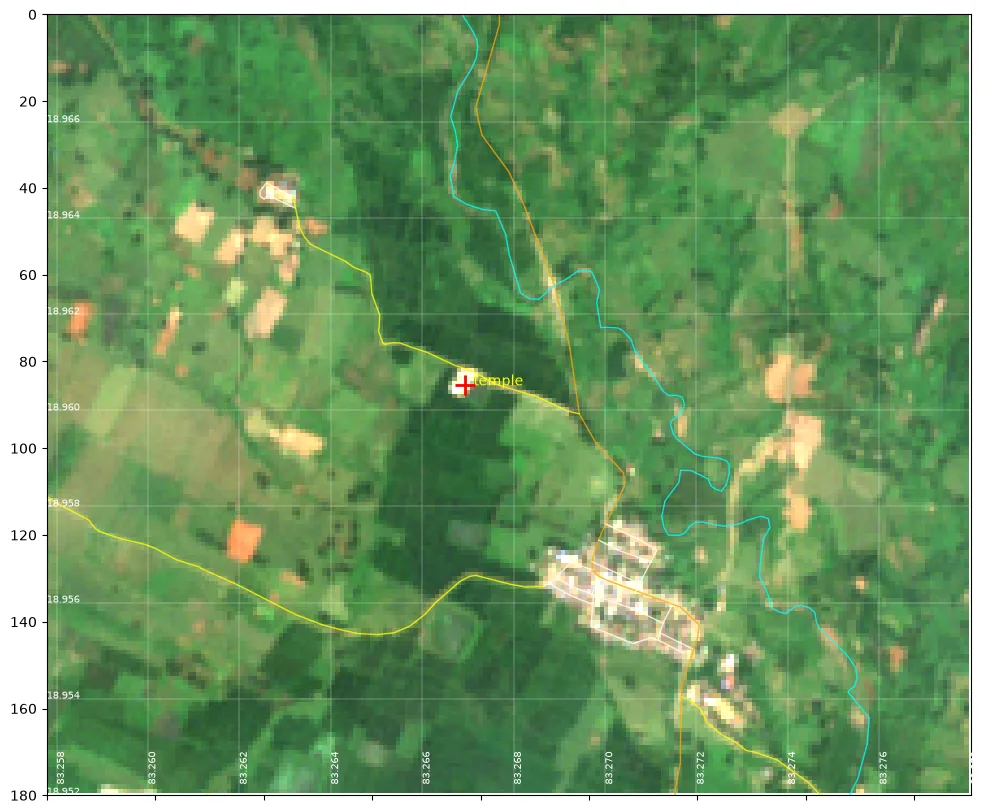
- Locations. The pond was found by matching a map screenshot to water seen by the satellite. The temple position comes from a public map listing (plus code X768+5R7), checked against photos and OpenStreetMap. The lined-up screenshot puts its pin within about 6 m of that point.
- Weekly update. A script builds the site from the data folders. It can be re-run each week after new photos are downloaded.
- Advice and checks (experimental). Yield comparison: the middle greenness of each plot on cloud-free photos (at least 60% clear) in the same 1–23 October window, 2025 against 2026. Harvest heads-up: the weekly change in the smoothed greenness. Weak patches: each square's greenness minus the field's middle value, taken over each October's cloud-free photos. Only squares fully inside the outline are tested. The temple plot also leaves out a 10 m strip round its edge; the pond fields are too small for that. A square counts as weak if it is in the lowest 20% in both seasons. Winter water: water pulled out by sun and wind minus rain from Nov 2025 to Feb 2026 (Open-Meteo), compared with the pond's November area for each metre of depth.
- Pest rules. These are copied unchanged from the government and rice-research documents listed below (who's who). They are not yet adjusted or scored for these plots.
Technical details (for specialists)
- Photos: Sentinel-2 Level-2A (haze-corrected), from the Microsoft Planetary Computer STAC catalogue, tiles 44QQF/44QQG. Map grid: UTM zone 44N (EPSG:32644).
- Bands are colours of light: B03 green, B04 red, B08 near-infrared (invisible), B11 short-wave infrared (invisible). NDVI = (B08−B04)/(B08+B04). NDWI = (B03−B08)/(B03+B08). MNDWI = (B03−B11)/(B03+B11).
- Clear squares for NDVI are the scene classes vegetation, bare soil and water. A −1000 offset is applied for processing baseline 4 and later.
- Crop series: median NDVI inside the outline, 20-day running median, peak, 0.7 and 0.5 crossings, dry-season floor and 50% amplitude green-up. Only WorldCover class 40 (cropland).
- Lining up screenshots: SIFT keypoint matching with a rotation-scale-shift fit and outlier rejection, against Esri World Imagery.
- Weak zones: Spearman rank correlation of per-pixel anomalies between Octobers 2025 and 2026; bottom-20% cut in both seasons.
Pest and disease sources
- ICAR-NCIPM (NICRA), Web enabled weather based prediction for insect pests of rice
- ICAR-NRRI (CRRI) Technology Bulletin 277, Rice blast disease and its integrated management
- ICAR-NRRI Agro-Advisory Service, first fortnight of September 2026
- ICAR-NRRI Agro-Advisory Service, October 2024 (district advisory incl. Koraput)
- Samir et al., J. Biopesticides 17(2):135–143 (2024), pest management in Koraput
- ICAR-IIRR, Demonstration of IPM practices in farmers' fields of Odisha (incl. Koraput)
- IRRI Rice Knowledge Bank, Sheath blight
- IRRI Rice Knowledge Bank, Bacterial blight
- IMD Agromet Advisory Services, district advisories
Please read with care
- FarmBot is an experiment. For now it uses satellites only. Always trust what you see in the field first.
- The field outlines are traced by hand, not surveyed. They were drawn from the maps you marked and lined up with close-up aerial photos (to within about 1–2 m). The edges are right to about 5–10 m.
- The photos are coarse. Each 10 m square is one dot of colour. The two pond fields hold only about 100 and 40 of these squares, and many mix in bunds and the next field. So detail inside a field is only a rough hint.
- Clouds hide the monsoon. In July and August there were only one or two cloud-free photos. So the satellite can't tell when transplanting happened.
- Soil and weather numbers are computer estimates, not measurements on these fields. Areas are approximate.