Our plots · Weather and pond water
Rain, heat and the pond
Computer weather estimates for the village area, and how much water the fishing pond held through the dry season.
Last 13 months · all estimates
One wet season, then a long dry one
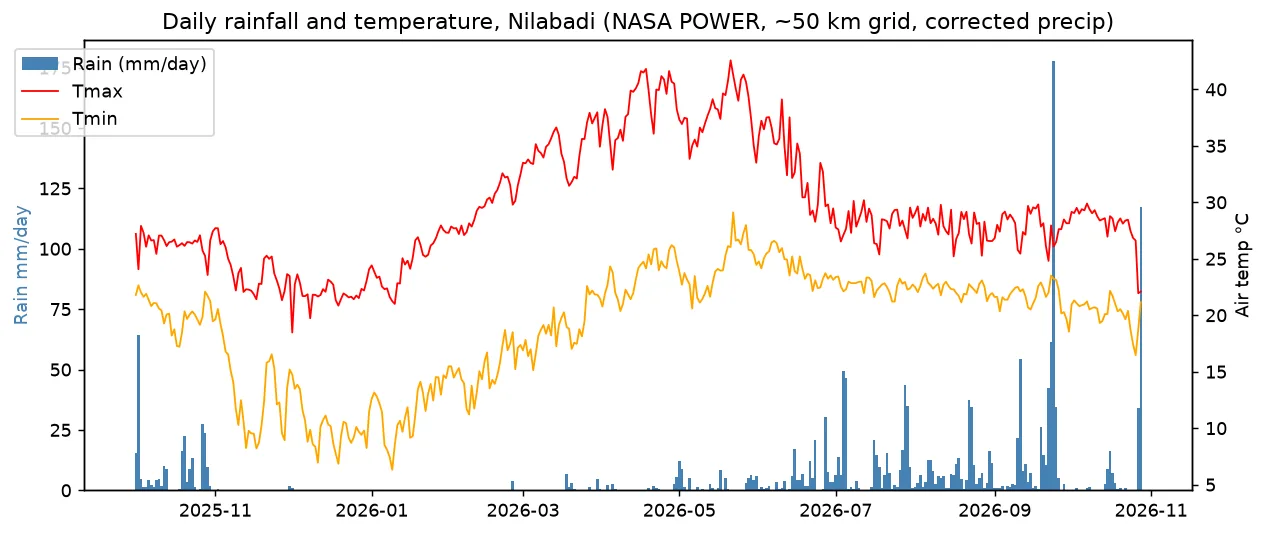
NASA's weather estimates (NASA POWER) put June–October 2026 rain at about 1,402 mm. The wettest month was Sep 2026, with 496 mm. 6 months had less than 25 mm of rain. The hottest month was Apr 2026, when the day high averaged 38.7 °C.
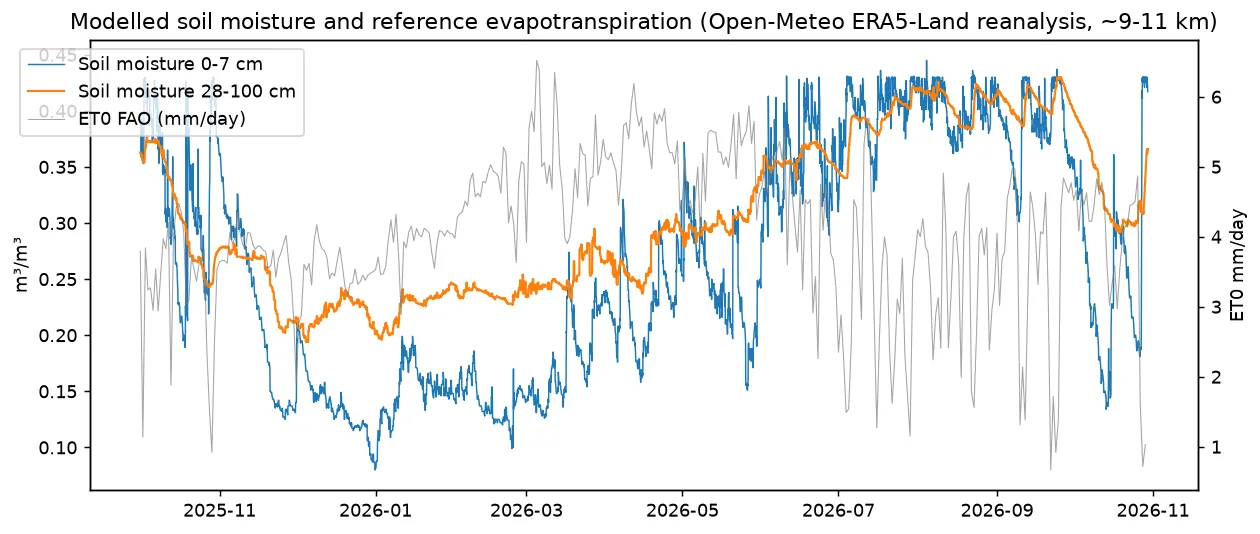
A second free weather service, Open-Meteo, gives 1,708 mm of rain over the same period. It also estimates that the sun and wind pull about 1,599 mm of water a year out of wet ground (what this means). Estimate
| Month | Rain, mm (NASA) | Average day high, °C | Average night low, °C | Rain, mm (Open-Meteo) | Water pulled out by sun and wind, mm (Open-Meteo) |
|---|---|---|---|---|---|
| Oct 2025 | 256 | 26.4 | 20.3 | 238 | 102 |
| Nov 2025 | 3 | 23.8 | 13.2 | 3 | 113 |
| Dec 2025 | 1 | 21.9 | 10.1 | 10 | 107 |
| Jan 2026 | 0 | 24.8 | 11.7 | 1 | 121 |
| Feb 2026 | 4 | 29.7 | 15.1 | 7 | 130 |
| Mar 2026 | 19 | 34.7 | 18.9 | 14 | 157 |
| Apr 2026 | 18 | 38.7 | 23.6 | 24 | 161 |
| May 2026 | 73 | 38.0 | 24.3 | 57 | 157 |
| Jun 2026 | 140 | 33.3 | 24.3 | 154 | 130 |
| Jul 2026 | 324 | 28.2 | 22.6 | 296 | 96 |
| Aug 2026 | 246 | 27.9 | 22.4 | 300 | 106 |
| Sep 2026 | 496 | 27.8 | 21.6 | 387 | 106 |
| Oct 2026 | 196 | 28.1 | 20.3 | 218 | 113 |
The last month may be incomplete. NASA's figures cover a square about 50 km wide. Open-Meteo's figures are weather rebuilt by computer on a grid about 9–11 km wide. Use them for trends, not exact amounts. There is no rain gauge on the farm yet.
Water · seen by satellite
How much water the fishing pond held
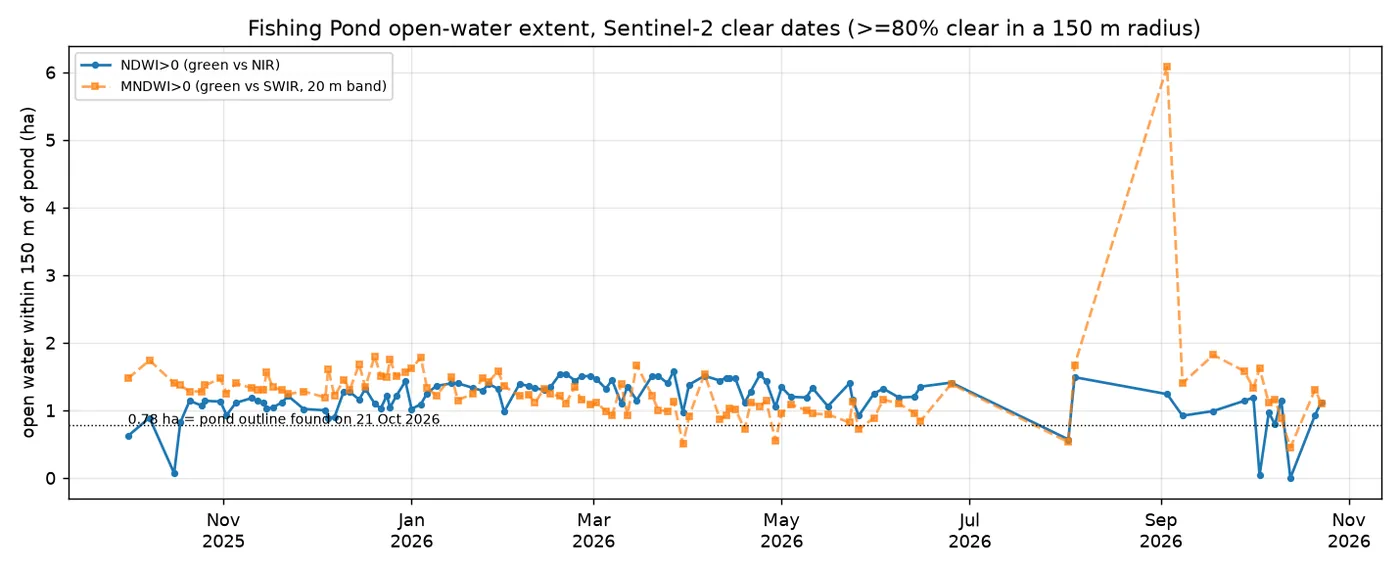
The pond held between 0.9 and 1.6 ha of open water (within 150 m of its centre, by the water score) on every cloud-free photo from Nov 2025 to Jun 2026. A second version of the score suggests it shrank by about 33% from Dec–Jan to Mar–May. Seen by satellite
6 months had under 25 mm of rain. So the pond's water in the dry months is what matters for any winter crop.