Nilabadi (Neelabadi) · Bandhugaon · Koraput
Village facts
A one-time page from 31 Oct 2026 that is not updated. It has the official 2011 records and a satellite look at a 2.2 km square around the village.
Official records
Nilabadi in numbers
These come from the 2011 Census of India village records and the government's village list (Local Government Directory), as shown on Odiapedia. They are from 2011 and may have changed.
2,123
people in 476 households (Census 2011).
511 ha
Village area: 511 hectares (about 1,263 acres). About 416 ha (about 1,028 acres) is sown with crops. About 173 ha (about 427 acres) gets canal water (Village Directory).
Paddy
is the main crop listed, then lemon grass and cotton. Village code 428775 in the government list. Neelabadi gram panchayat.
One-time satellite look · a 2.2 km square
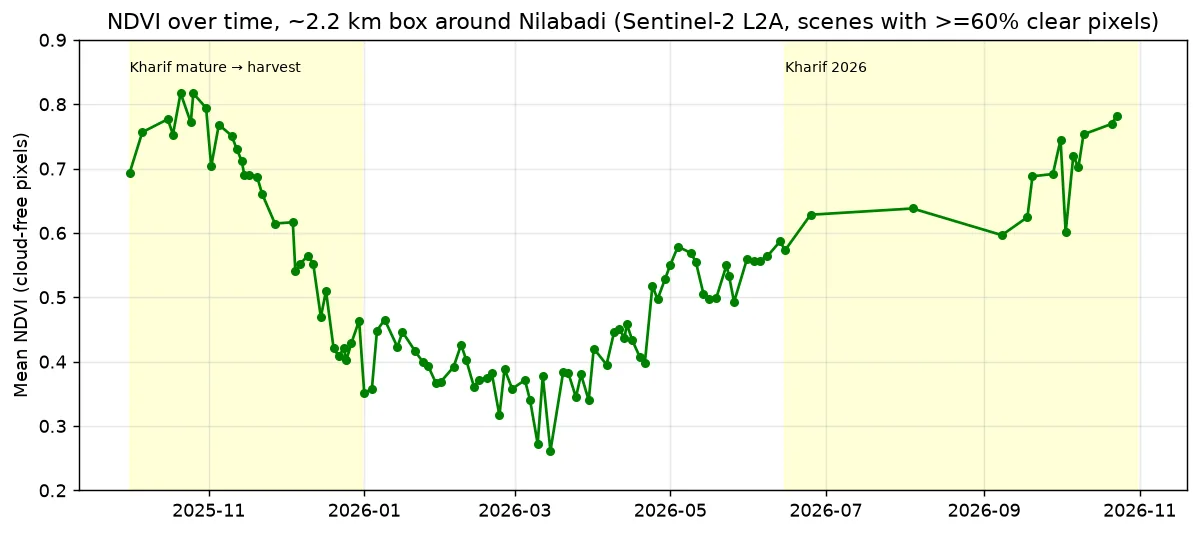
Green now, brown in March
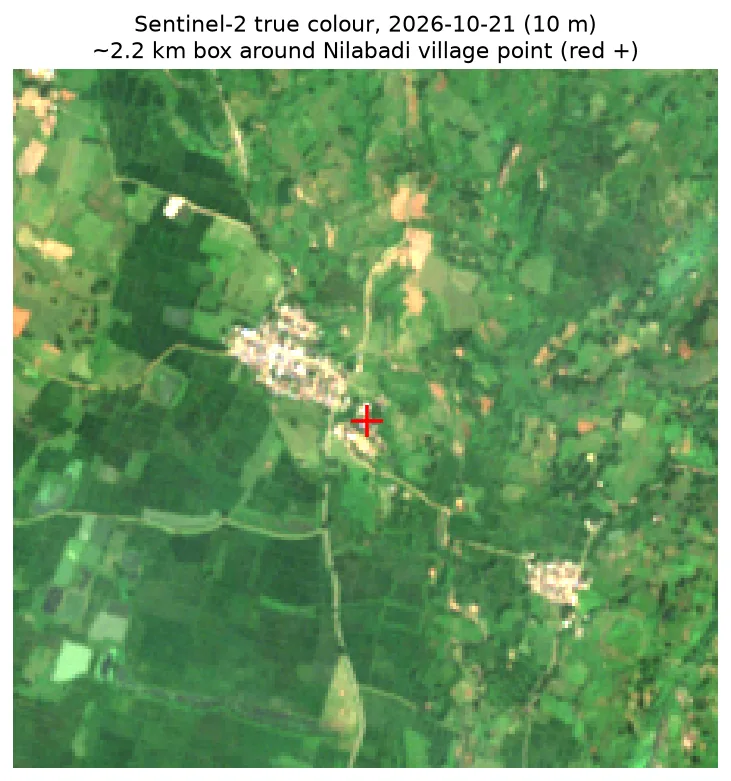
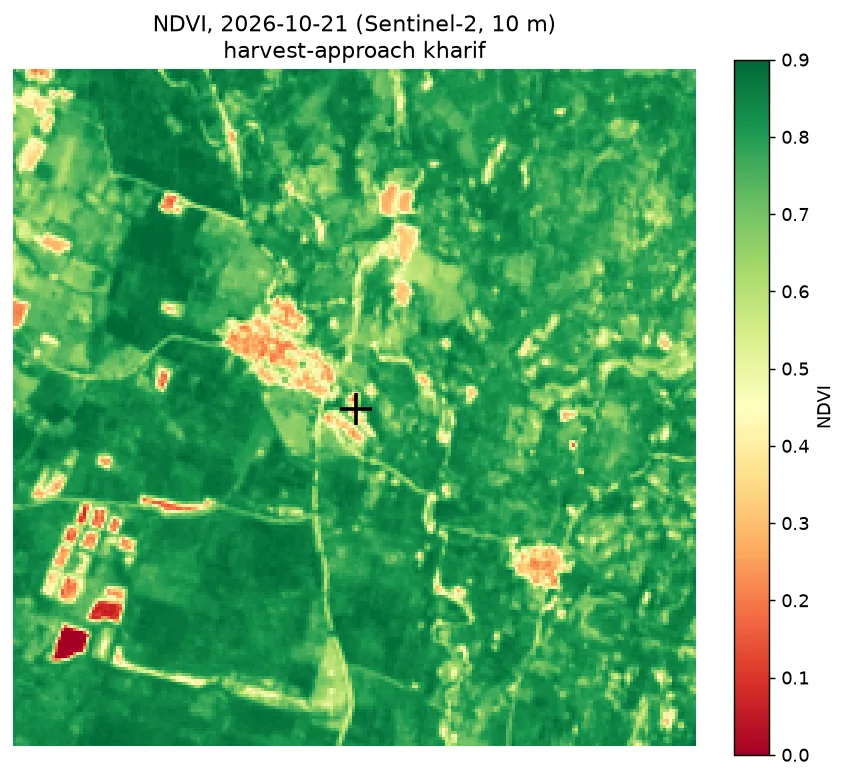
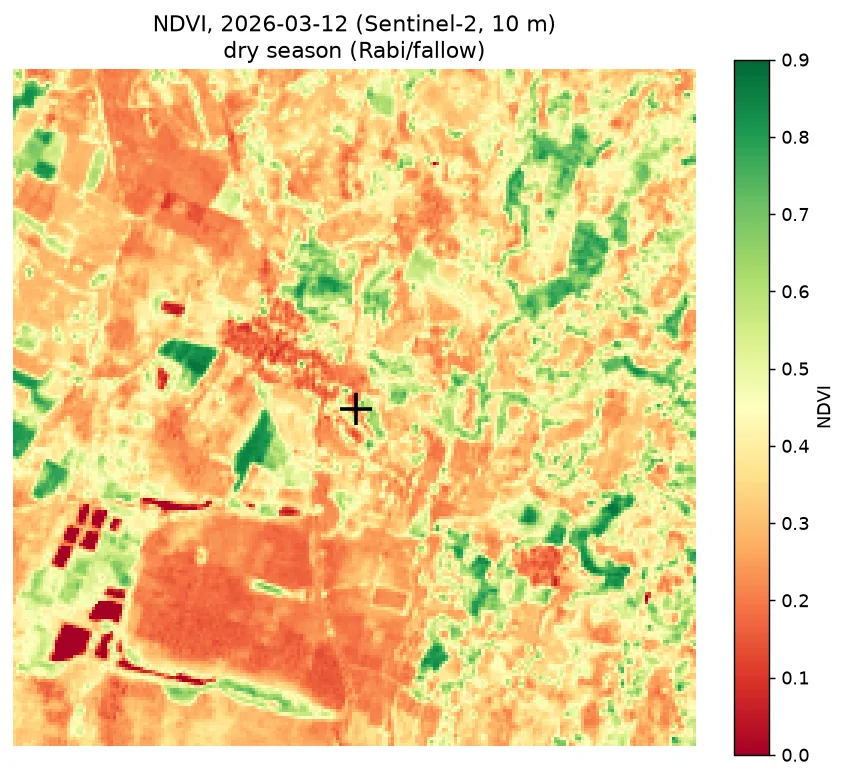
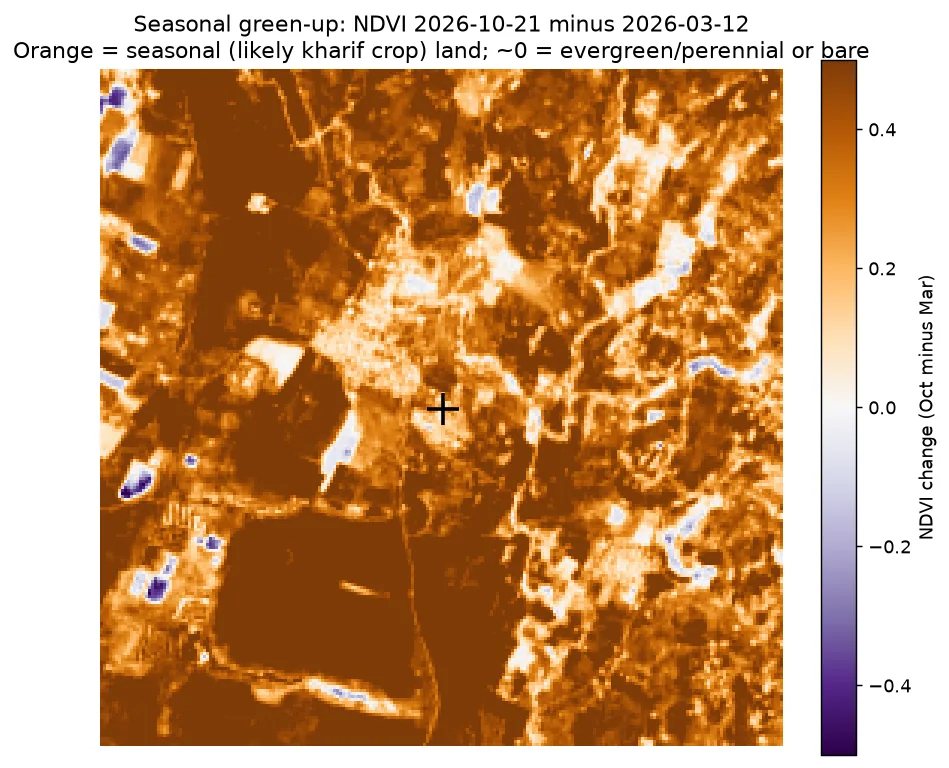
FarmBot looked at a 2.2 km square around the village. On 21 Oct 2026 the average greenness score was 0.77, and 96% of the 10 m squares scored above 0.5. On 12 Mar 2026, in the dry season, it was 0.37 (18% above 0.5).
74% of the square got greener by more than 0.3 between the dry season and the monsoon. That is the pattern of one rain-fed crop a year, grown in the monsoon season. Seen by satellite
What covers the land
About half is crop fields
From a free 2021 land-use map. Technical name: ESA WorldCover 2021
| Land type | Share of the 2.2 km square |
|---|---|
| Crop fields | 48.8% |
| Trees | 29.1% |
| Grass and open land | 20.3% |
| Houses, roads and buildings | 1.7% |
| Water | 0.1% |
The map was made in 2021 from 10 m squares, so it doesn't show later changes.