Our plots · Nilabadi (Neelabadi), Bandhugaon, Koraput
Nilabadi Fishing Pond fields
Two paddy fields traced from a marked map. Satellite photos, greenness maps, the crop's year month by month, a weak-patch check, pond water and a soil estimate.
Where
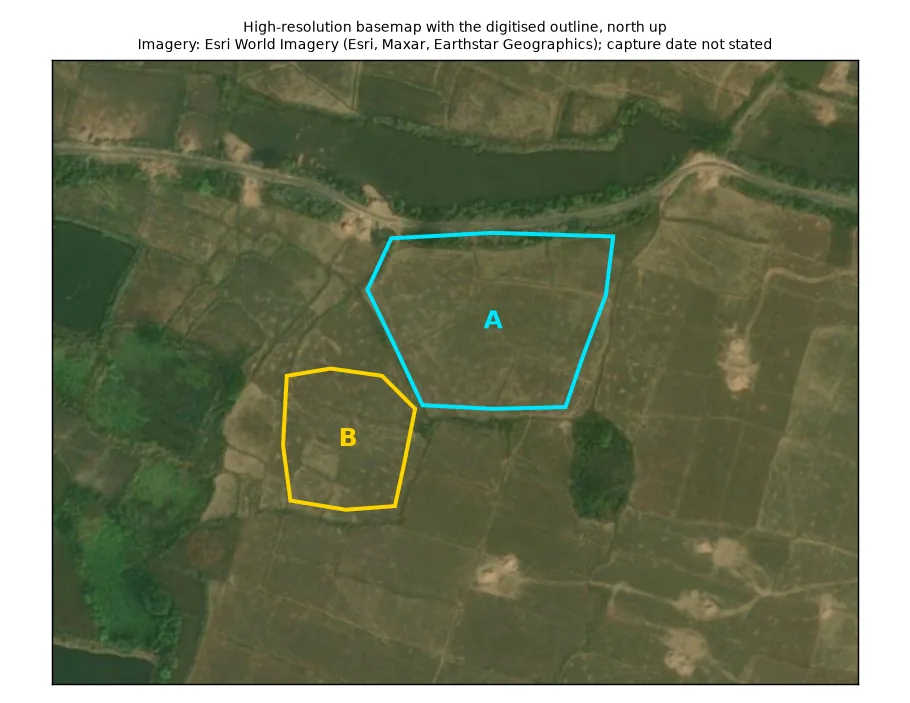
The exact fields
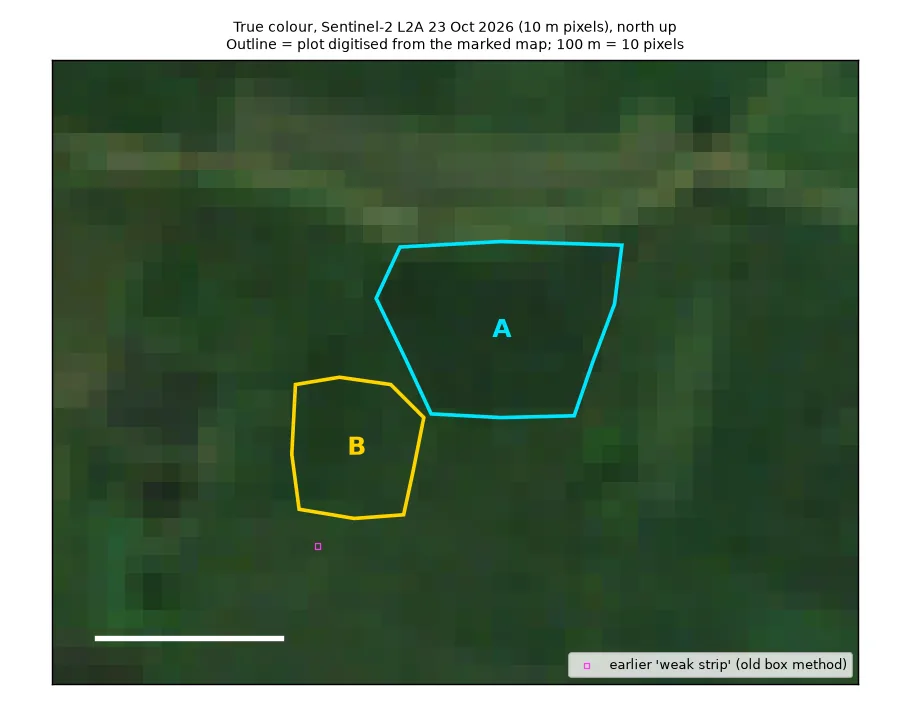
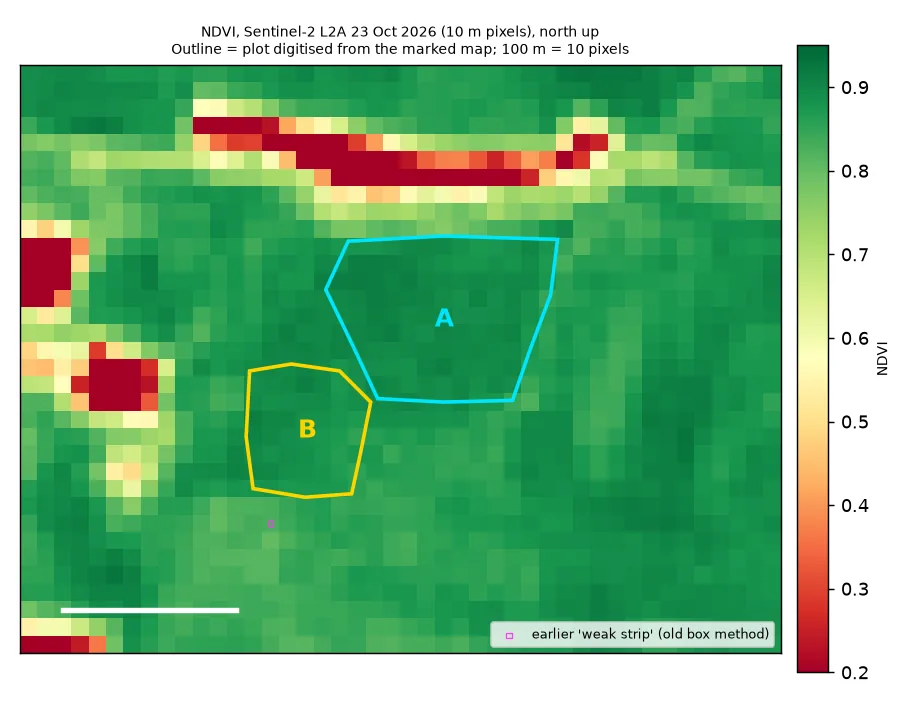
Traced from the map screenshot you marked. Each screenshot was fitted onto close-up aerial photos by matching roads, ponds and tree clumps, to within about 2 m (how this works). Only 10 m squares whose centre is inside the outline count towards the crop numbers.
| Field | Centre (map position) | Size | Number of 10 m squares | How sure we are |
|---|---|---|---|---|
| Pond-area field A (north-east, by the road) | 18.95065 N, 83.26737 E | 1.04 ha 2.57 acres | 103 (85 fully inside) | Position: sure. Edges: fairly sure (within 5–10 m). Faint lines inside may mean it is more than one field. |
| Pond-area field B (south-west) | 18.95004 N, 83.26660 E | 0.47 ha 1.15 acres | 42 (37 fully inside) | Position: sure. Edges: fairly sure. The west edge is unclear. It may be the bund at the outline, or a terrace edge about 25 m further west. |
| Both fields together | 18.95046 N, 83.26713 E | 1.51 ha 3.72 acres | 145 | The two fields meet only at one corner, about 4 m apart. |
Crop health · greenness inside the outline
The crop's year, month by month
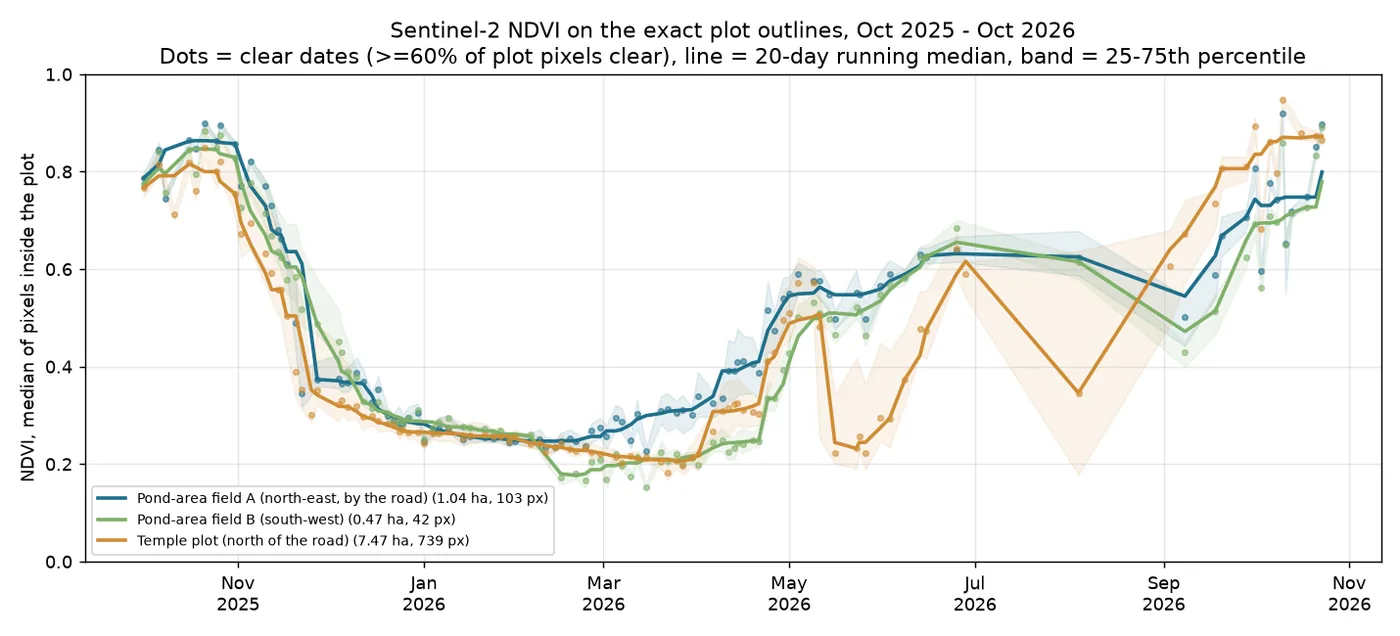
Built from 106 cloud-free satellite photos (at least 60% of the squares inside the outline were clear of cloud). The labels say what the greenness shows. They are not records of work done in the field. Seen by satellite Technical name: NDVI and phenology
25
25
25
26
26
26
26
26
26
26
26
26
26
How to read this: each box is one month, from October 2025 to October 2026. Its colour shows what the field mostly looked like from space that month.
| 2025 monsoon crop at its greenest (smoothed) | 0.86 on about 18 Oct 2025 |
| Ripening started: greenness fell below 0.7 | 12 Nov 2025 |
| Mostly harvested: greenness fell below 0.5 | 27 Nov 2025 |
| Lowest point in the dry season (smoothed) | 0.24 on about 13 Feb 2026 |
| 2026 crop half-way green (rough) | about 3 Jun 2026 |
| September 2026, middle value | 0.61 |
| Latest cloud-free photos | 18 Oct: 0.74, 21 Oct: 0.85, 23 Oct: 0.90 |
| Pond-area field A (north-east, by the road): greenest in 2025 · greenest so far in 2026 | 0.86 · 0.80 |
| Pond-area field B (south-west): greenest in 2025 · greenest so far in 2026 | 0.85 · 0.78 |
In 2025 the pond fields were greenest at 0.86, around 18 Oct. They were mostly harvested by 27 Nov. In 2026 they turned green more slowly than the temple plot. In September their middle greenness was 0.61, against 0.73 for the temple plot. They were still getting greener on 23 Oct.
Unlike the temple plot, these fields stayed fairly green (greenness about 0.5–0.64) from late April into June 2026, before the monsoon crop. Something was growing there: a summer crop, a seedling nursery or weeds. Please check this on the ground, because it moves the "half-way green" date above.
Inside the field · 10 m squares
Is any part of the field always weaker? Experimental
Each 10 m square fully inside the outline is compared with the field's middle value on the same day. This uses the cloud-free photos of 1–23 October, in both 2025 and 2026. A real weak patch would be low in both years.
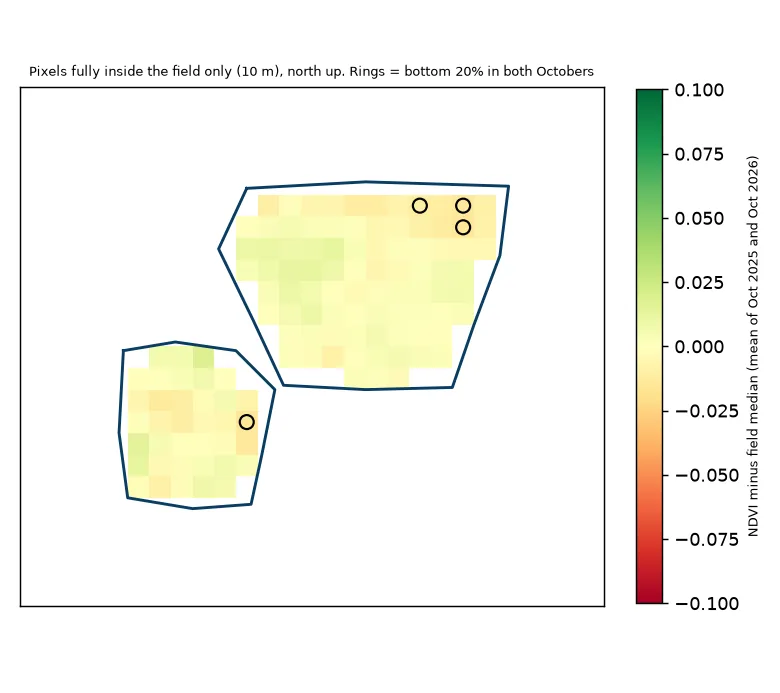
Result: no weak patch
- Pond-area field A (north-east, by the road): 85 squares tested. Year-to-year match score: -0.37. 3 square(s) were in the lowest 20% in both years (4%, against about 4% you'd expect by chance).
- Pond-area field B (south-west): 37 squares tested. Year-to-year match score: -0.04. 1 square(s) were in the lowest 20% in both years (3%, against about 4% you'd expect by chance).
The squares that were low in one year are not the ones that were low in the other. So FarmBot does not claim a weak patch. The pond fields are too small to leave out the edge squares, so many tested squares still mix in bunds and the next field. The weak strip north of the pond in the old snapshot is outside these fields (about 250 m away, none of it inside). So it says nothing about them. It stays in the snapshot. Technical name: weak-zone check with Spearman rank correlation
Pond water · seen by satellite
The pond held water all dry season
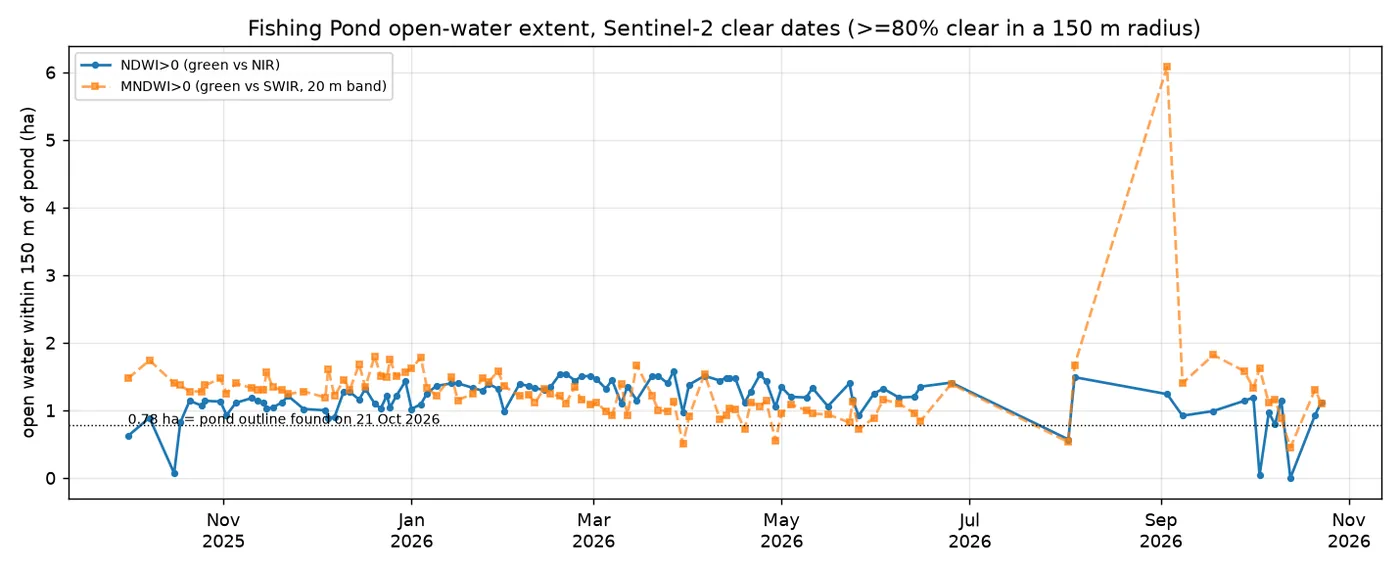
The main fishing pond is about 487 m from the fields. FarmBot measured the open water within 150 m of the pond's centre, using the water score (above 0 means water). It stayed between 0.9 and 1.6 ha on every cloud-free photo from Nov 2025 to Jun 2026.
The second version of the water score suggests the pond shrank from about 1.5 ha (Dec–Jan middle value) to about 1.0 ha (Mar–May middle value). This is the water's surface area only. The satellite can't see depth or how much water there is. Seen by satellite Technical name: NDWI and MNDWI
Soil · from a world soil map
What the soil is probably like Estimate
A slightly sour (acidic) loam (a mixed, easy-to-work soil) on top, with heavier clay-loam below, with pH 6.2–6.4. (pH 7 is neutral; lower is more sour.) The values are read at the centre of field A. Field B falls in the same 250 m square of the map, so it gets the same values. They come from a world soil map that predicts soil on 250 m squares, much bigger than the fields. Get a Soil Health Card or a lab test before deciding on fertiliser. Technical name: ISRIC SoilGrids 2.0
| What | Top 5 cm | 5–15 cm deep | 15–30 cm deep |
|---|---|---|---|
| Clay (%; sticky, fine particles) | 25.5 | 28.8 | 32.2 |
| Sand (%; gritty, coarse particles) | 39.7 | 37.3 | 34.9 |
| Silt (%; smooth, middle-sized particles) | 34.8 | 33.9 | 32.8 |
| Sourness (pH) (scale 0–14; below 7 is slightly sour, or acidic) | 6.2 | 6.2 | 6.4 |
| Organic matter (carbon) (grams per kg; from rotted plants; more is better) | 26.4 | 15.2 | 10.9 |
| Total nitrogen (grams per kg; a main plant food) | 1.83 | 1.4 | 0.96 |
| Nutrient-holding power (a lab unit, cmol(c)/kg; technical name: CEC) | 17.3 | 16.0 | 15.0 |
| How tightly packed (grams per cm³; technical name: bulk density) | 1.31 | 1.33 | 1.36 |
Please read with care
- FarmBot is an experiment. For now it uses satellites only. Always trust what you see in the field first.
- The field outlines are traced by hand, not surveyed. They were drawn from the maps you marked and lined up with close-up aerial photos (to within about 1–2 m). The edges are right to about 5–10 m.
- The photos are coarse. Each 10 m square is one dot of colour. The two pond fields hold only about 100 and 40 of these squares, and many mix in bunds and the next field. So detail inside a field is only a rough hint.
- Clouds hide the monsoon. In July and August there were only one or two cloud-free photos. So the satellite can't tell when transplanting happened.
- Soil and weather numbers are computer estimates, not measurements on these fields. Areas are approximate.