Plot · Nilabadi (Neelabadi), Bandhugaon, Koraput
Nilabadi Fishing Pond plot
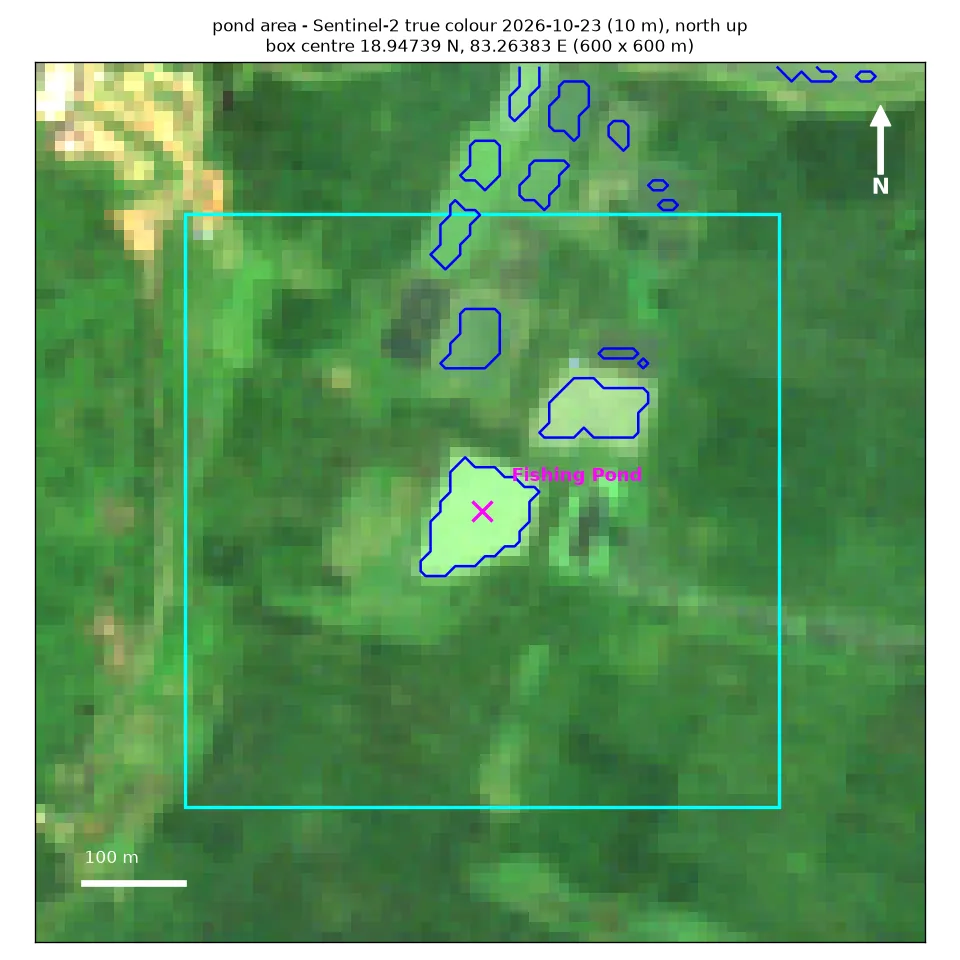
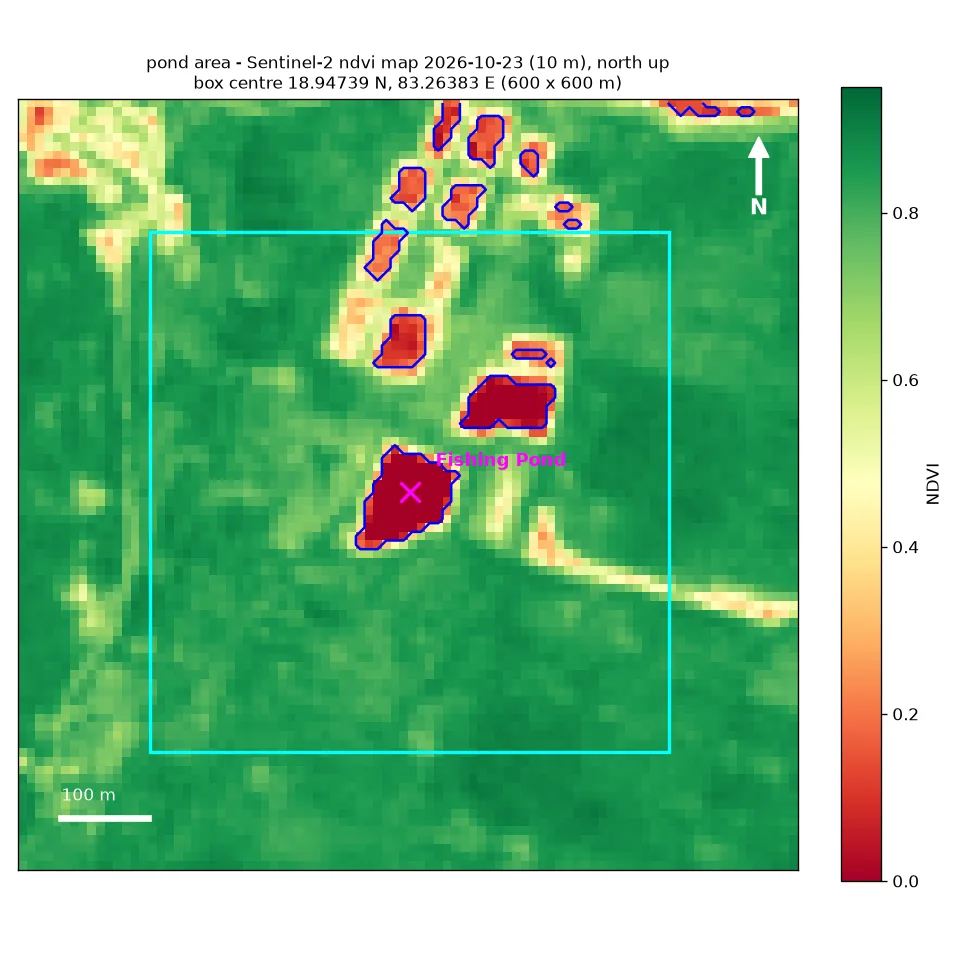
Paddy. Sentinel-2 (European satellites that photograph the fields about every 5 days) imagery, greenness score (NDVI) maps, a crop calendar from Greenness map, pond water extent and computer-estimated soil.
Where
Approximate location
A 600 × 600 m box centred about 18.947 N, 83.264 E. A 2021 European land-cover map (ESA WorldCover) labels it as 79% cropland, 11% trees, 8% grassland and 1.3% water. Only crop-land squares feed the crop numbers.
Crop health · how green the crop land is
Crop calendar from the satellite
Built from 105 clear satellite photos. The phases describe what greenness shows, not field operations recorded on the ground. Seen by satellite
25
25
25
26
26
26
26
26
26
26
26
26
26
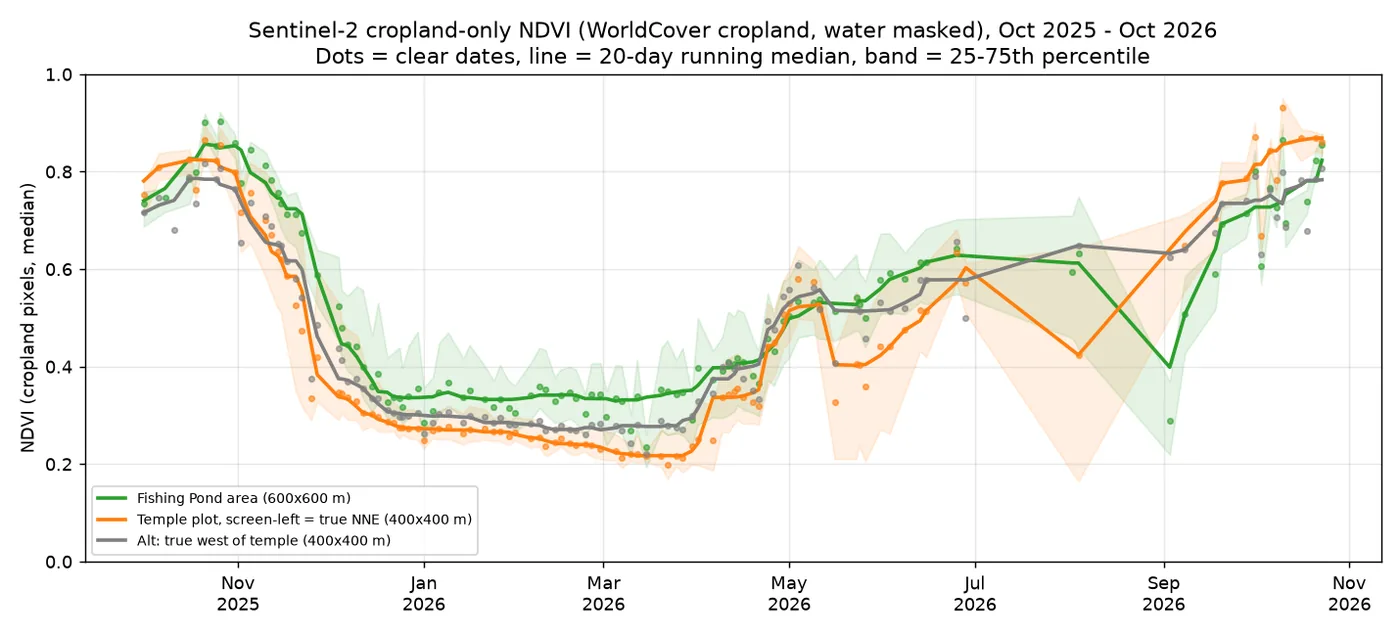
| 2025 monsoon crop: greenest point (smoothed over 20 days) | 0.86 on ~21 Oct 2025 |
| Ripening / harvest: greenness below 0.7 | 27 Nov 2025 |
| Harvest largely done: greenness below 0.5 | 4 Dec 2025 |
| Dry-season low (middle value, Feb – mid-Apr 2026) | 0.34 |
| 2026 green-up (50% of the way to full green, rough) | ~3 Jun 2026 |
| September 2026 median | 0.59 |
| Latest clear dates | 18 Oct: 0.74, 21 Oct: 0.82, 23 Oct: 0.86 |
In 2025 this plot stayed green longest of the areas checked. It peaked at 0.86 around 21 Oct and was mostly harvested by 4 Dec. Its September 2026 median (0.59) was lower than the temple plot's (0.74), and it is now close to peak.
Pond water · from satellite photos
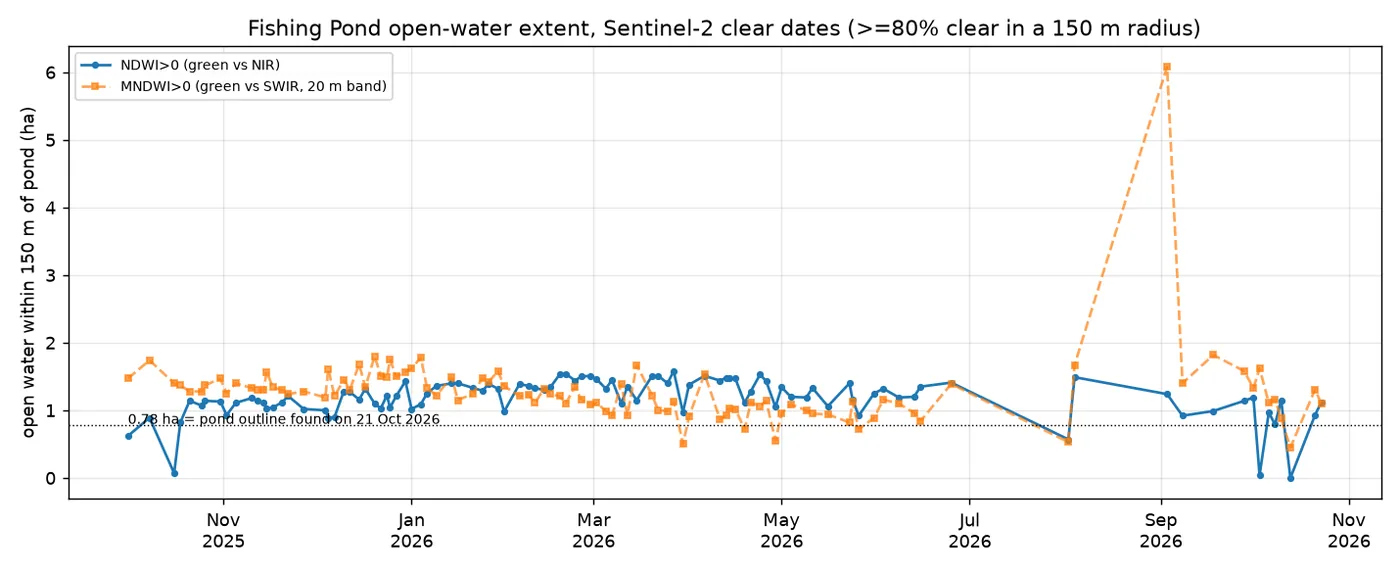
The pond held water all dry season
Open water within 150 m of the pond centre (water score (NDWI) > 0) stayed between 0.9 and 1.6 ha (about 2.2–4.0 acres) on every clear date from Nov 2025 to Jun 2026. The second water score (MNDWI) suggests it shrank from ~1.5 ha (Dec–Jan median) to ~1.0 ha (Mar–May median). That is surface area only, not depth or volume. Seen by satellite
Soil · from a global soil map (SoilGrids (a global computer soil map) 2.0), 250 m squares
Soil estimate Estimate
A slightly acidic loam at the surface, clay-loam below (pH 6.2–6.3). These are computer estimates for 250 m squares, and the two plots are close enough that they're barely independent. Get a Soil Health Card or lab test before any fertiliser decision.
| Property | 0–5 cm | 5–15 cm | 15–30 cm |
|---|---|---|---|
| Clay (%) | 23.8 | 26.9 | 29.5 |
| Sand (%) | 40.7 | 38.7 | 37.5 |
| Silt (%) | 35.4 | 34.4 | 33.0 |
| pH (water) (pH) | 6.2 | 6.3 | 6.3 |
| Soil organic carbon (g/kg) | 29.1 | 17.3 | 10.1 |
| Total nitrogen (g/kg) | 1.59 | 1.34 | 0.95 |
| CEC (cmol(c)/kg) | 15.7 | 14.2 | 13.8 |
| Bulk density (g/cm3) | 1.31 | 1.34 | 1.36 |
Read with care
- Plot boxes are approximate. They are squares drawn around landmarks, not surveyed field boundaries.
- Monsoon cloud gap. July–August had only one or two clear satellite photos, so transplanting dates can't be pinned down.
- Temple plot location is still to be confirmed. The reference screenshot was rotated, so the box sits north-north-east of the temple; a true-west alternative was also checked.
- Soil and weather figures are computer-estimated estimates, not measurements on these fields.