Methods
Methods & data sources
Where every number comes from: what the satellite saw, and what a computer estimated.
Sources
Data sources
| Source | Used for | Type |
|---|---|---|
| Sentinel-2 (Europe's free Copernicus photo satellites, about one photo every 5 days; L2A = photos already corrected for haze), via Microsoft Planetary Computer | 10 m colour and infrared photos, photo tiles 44QQF/44QQG. Formulas: greenness score (NDVI) = (B08−B04)/(B08+B04); water score (NDWI) = (B03−B08)/(B03+B08); second water score (MNDWI) = (B03−B11)/(B03+B11). Clear squares for greenness = squares the satellite's own sorter labels plants, bare soil or water; a fixed −1000 correction is applied to newer photos (processing baseline ≥ 4). | Observed |
| ESA WorldCover 2021 v200 | 10 m land-cover map (what covers each square). Only crop land (class 40) feeds the plot crop series, with persistent water and trees excluded. | Classified (2021) |
| ISRIC SoilGrids (a global computer soil map) 2.0 | Global computer soil map, 250 m squares: texture, pH, organic carbon, nitrogen, nutrient-holding capacity (CEC) and how packed the soil is (bulk density), read from ISRIC's public files because its online service was down. | Estimate |
| NASA POWER (a free NASA weather estimate) daily | Rain, temperature, humidity, solar radiation and wetness around the roots, ~50 km squares. | Estimate |
| Open-Meteo (a free weather service) historical weather API | Computer-reconstructed (reanalysis) rain, ET0 (water that sun and wind pull from a crop) and soil moisture. | Estimate |
| OpenStreetMap | Roads, river and village points used to check locations. | Mapped |
| Census of India 2011 and LGD (Local Government Directory), via Odiapedia | Population, households, area and land use for Nilabadi. | Official (2011) |
How
Method
- Plots. Square boxes around two landmarks: 600 m around the fishing pond and 400 m north-north-east of the Agnigangamma Temple. They are not surveyed field boundaries.
- Crop series. For each clear Sentinel-2 (European satellites that photograph the fields about every 5 days) date (1 Oct 2025 to 23 Oct 2026), FarmBot takes the median (middle value) greenness of crop-land squares in the box. A 20-day running median smooths it, and the peak, the drops below 0.7 and 0.5, the dry-season low and the point halfway to full green (50%) are read off that curve.
- Pond water. Squares with water > 0 or second water > 0 within 150 m of the pond centre, converted to hectares (1 hectare ≈ 2.5 acres). For this metric only cloud, shadow and snow are removed, because the satellite's own sorter mislabels this pond as soil.
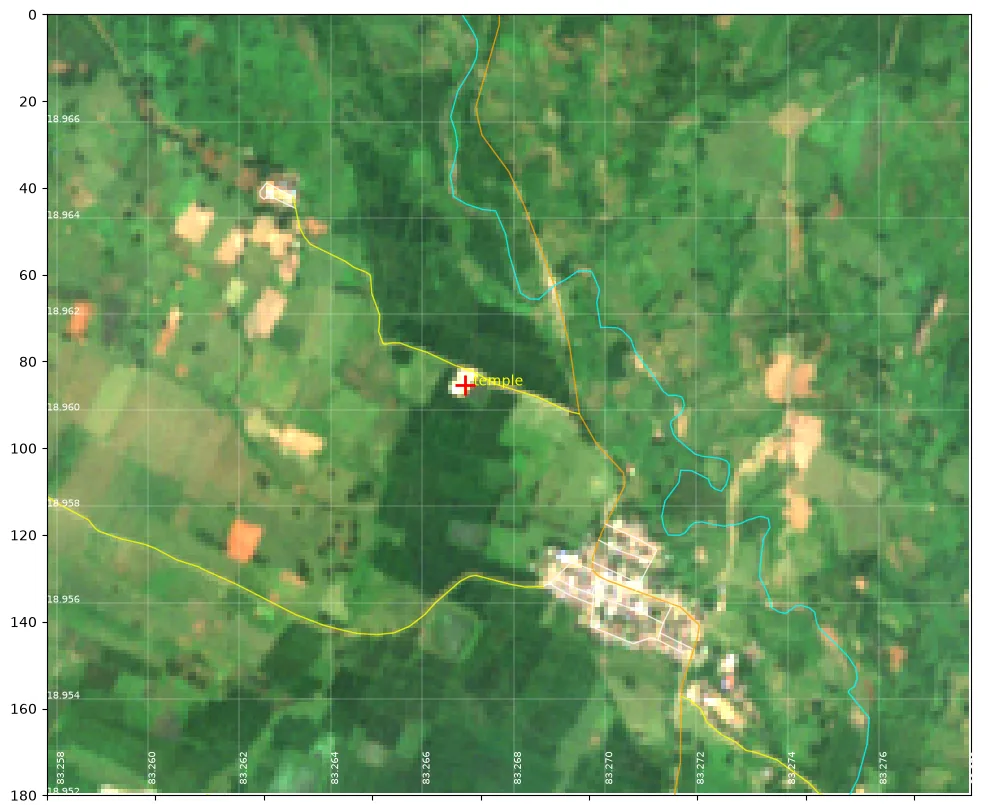
- Locations. The pond was found by matching a map screenshot to Sentinel-2 water. The temple comes from a public place listing (map plus code X768+5R7) checked against imagery and OpenStreetMap.
- Refresh. The site is generated from the data folders by a build script, and can be rebuilt weekly after new photos are downloaded.
- Insights (experimental). Crop comparison: the median of each plot's crop-land greenness (NDVI) over clear dates (photos at least 60% cloud-free) in the shared 1–23 October window, 2025 vs 2026. Harvest heads-up: the weekly change in the 20-day smoothed greenness. Weak patches: each square's greenness minus the plot median, as a median over clear dates in each October. The cut is the bottom 20% in both seasons, after removing a 20 m edge strip next to land that is not crop land. Winter-crop budget: Nov 2025 – Feb 2026 Open-Meteo crop water need (ET0) minus rain, against the November median pond area (MNDWI) per metre of depth.
- Pest rules. These are taken unchanged from the cited ICAR-NCIPM (India's national centre for pest management), ICAR-NRRI (National Rice Research Institute) and IRRI (International Rice Research Institute) documents. They are not tuned or scored for these plots yet.
Pest & disease sources
- ICAR-NCIPM (NICRA), Web enabled weather based prediction for insect pests of rice
- ICAR-NRRI (CRRI) Technology Bulletin 277, Rice blast disease and its integrated management
- ICAR-NRRI Agro-Advisory Service, first fortnight of September 2026
- ICAR-NRRI Agro-Advisory Service, October 2024 (district advisory incl. Koraput)
- Samir et al., J. Biopesticides 17(2):135–143 (2024), pest management in Koraput
- ICAR-IIRR, Demonstration of IPM practices in farmers' fields of Odisha (incl. Koraput)
- IRRI Rice Knowledge Bank, Sheath blight
- IRRI Rice Knowledge Bank, Bacterial blight
- IMD Agromet Advisory Services, district advisories
Read with care
- Plot boxes are approximate. They are squares drawn around landmarks, not surveyed field boundaries.
- Monsoon cloud gap. July–August had only one or two clear satellite photos, so transplanting dates can't be pinned down.
- Temple plot location is still to be confirmed. The reference screenshot was rotated, so the box sits north-north-east of the temple; a true-west alternative was also checked.
- Soil and weather figures are computer-estimated estimates, not measurements on these fields.