Insights
Advice, crop comparison and water
Weekly advice, a crop comparison score (crop comparison score) and five more satellite ideas. Early results are marked experimental.
Priority 2
Weekly recommendations
Each week FarmBot will write a short note per plot. It combines the crop stage from satellite, the pest-risk check, the rain versus crop water need, and the newest ICAR-NRRI (National Rice Research Institute) and IMD (India Meteorological Department) farm-weather advisories for Koraput. Every line will cite its source, and anything estimated by computer will say so.
Crop stage
From the greenness score (NDVI) curve now, from radar later. Shown on each plot page.
Water
Rain minus the water that sun and wind pull from a crop (ET0) for the past and coming week Estimate, and pond water area Seen by satellite.
Pests and official advice
The pest-risk check, plus links to the matching advisory text. The note does not prescribe doses.
Priority 3
Crop comparison score Experimental
Satellites can't weigh grain. What they can show is how green and dense the leaf cover was compared with other seasons and plots. FarmBot will use the season's peak greenness and the season's summed greenness over the whole season as a relative index, not tonnes.
| Plot | Median Greenness map, 1 Oct–23 Oct 2025 | Same window, 2026 | 2026 ÷ 2025 |
|---|---|---|---|
| Nilabadi Fishing Pond plot | 0.78 (0.73–0.90, 5 photos) | 0.77 (0.61–0.86, 9 photos) | 0.98 |
| Agnigangamma Temple plot | 0.81 (0.75–0.86, 5 photos) | 0.86 (0.67–0.93, 8 photos) | 1.07 |
What this does and doesn't show
- The data start on 1 Oct 2025, so the only window both seasons share is 1–23 October, near the peak. That window is compared here, not the whole season.
- The 2026 season isn't finished, so its peak and season-total greenness aren't known yet.
- Both ratios sit inside the date-to-date spread shown in brackets. Read them as no clear difference between 2025 and 2026 yet.
- Season-total greenness becomes possible once a complete season is on file. Comparing against nearby village fields comes later (see below).
Also planned · A
Harvest-timing heads-up Experimental
FarmBot watches the weekly change in each plot's smoothed greenness. When it starts falling steadily after the peak, the crop is ripening. A drop below 0.7 and then 0.5 marked the 2025 harvest window.
Nilabadi Fishing Pond plot
In 2025 the smoothed greenness fell below 0.7 on 27 Nov and below 0.5 on 4 Dec. Latest smoothed value: 0.82 on 23 Oct, +0.04 over the past week. No ripening decline yet. Seen by satellite
Agnigangamma Temple plot
In 2025 the smoothed greenness fell below 0.7 on 10 Nov and below 0.5 on 25 Nov. Latest smoothed value: 0.87 on 23 Oct, +0.00 over the past week. No ripening decline yet. Seen by satellite
Last year's dates are a guide, not a forecast. Variety and transplanting date change the timing, and November cloud can delay the signal.
Also planned · B
Weak patches inside a plot Experimental
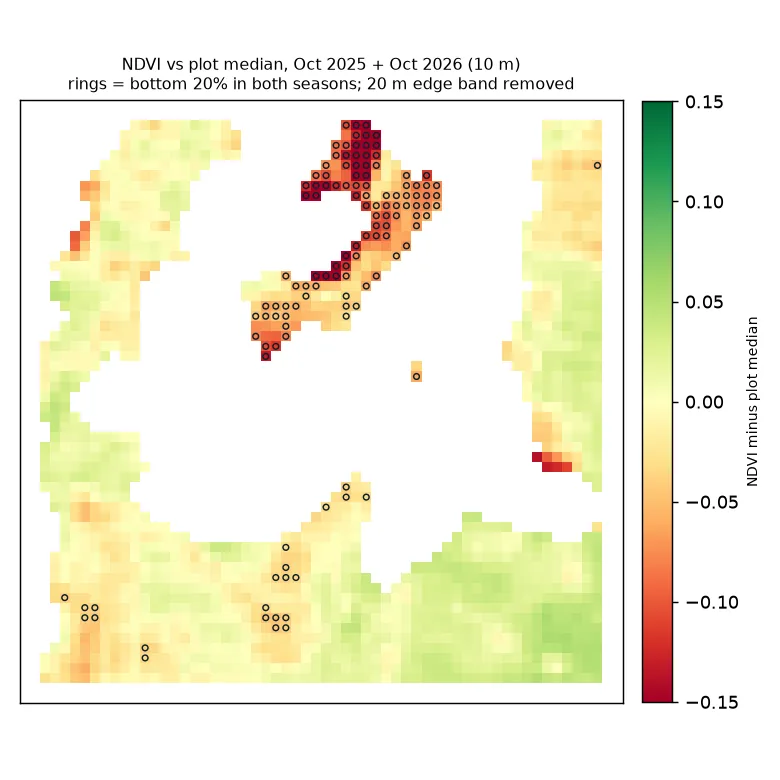
For each 10 m square, FarmBot compares its greenness with the plot's median (middle value) on the same date, over the clear dates of 1–23 October in both 2025 and 2026. A square in the bottom 20% in both seasons is a possible weak patch. Squares within 20 m of water, trees or houses are dropped, because mixed squares there look weak.
What it shows
Fishing Pond plot: one strip just north of the pond stays about 0.1 greenness below the plot median in both seasons. It's a place to check on the ground: it could be a weak patch, a different crop, or a land-cover mislabel.
Temple plot: the patterns don't repeat between seasons (agreement -0.02, which means no link), so no weak patches are claimed. The plot location is also still to be confirmed.
Use for sensors: put the first soil-moisture probe in a consistent weak patch and one in a typical zone, so the pair shows what differs.
Also planned · C
Radar that sees through cloud (Sentinel-1)
Radar sees through monsoon cloud. Standing water on a paddy field weakens the radar echo, which then rises as the leaf cover grows. That gives flooding and waterlogging dates and an estimate of the transplanting date, during the July–August months that Sentinel-2 (European satellites that photograph the fields about every 5 days) missed. These feed the crop-stage and humidity inputs of the pest-warning rules. Method only for now; no radar has been processed yet.
Also planned · D
Winter-crop water budget Experimental
Can the pond carry a low-water winter crop such as green gram, black gram or mustard? The budget compares the water the pond holds with the crop's need after winter rain.
1.30 ha (about 3.2 acres)
Median pond water area in November 2025 (10 clear dates, second water score (MNDWI)). It was 0.99 ha (about 2.4 acres) in March–May 2026. Seen by satellite
471 − 20 mm
Crop water need (ET0) minus rain, 1 Nov 2025 – 28 Feb 2026: a deficit of 451 mm. Estimate Open-Meteo (a free weather service).
≈ 2.9 ha per metre
Each metre of usable depth over 1.30 ha (about 3.2 acres) holds about 13,000 m³ (cubic metres). At that standard rate, that covers about 2.9 ha (about 7.2 acres) of crop.
Big unknowns
- Pond depth is unknown. The answer scales directly with usable depth, so it has to be measured, for example with a level sensor or a staff gauge.
- The figure assumes the crop uses water at the standard crop water need (ET0). Crop factors for each crop, field losses, the pond's own evaporation and seepage, and fish needs are not yet included. Those losses will lower the hectares (1 hectare ≈ 2.5 acres).
- Whether the farmers want a winter (rabi) crop, and other water sources, are still to be confirmed.
Also planned · E · later
Neighbouring fields as the baseline
Comparing a plot only with itself can't separate a bad season from a weak field. Later, FarmBot will compare each plot's peak and season-total greenness with nearby Nilabadi cropland in the same season. That turns the crop comparison score into "better or worse than the neighbours". This comes with the village-wide view.