Plots · Nilabadi (Neelabadi), Bandhugaon, Koraput
Temple plot
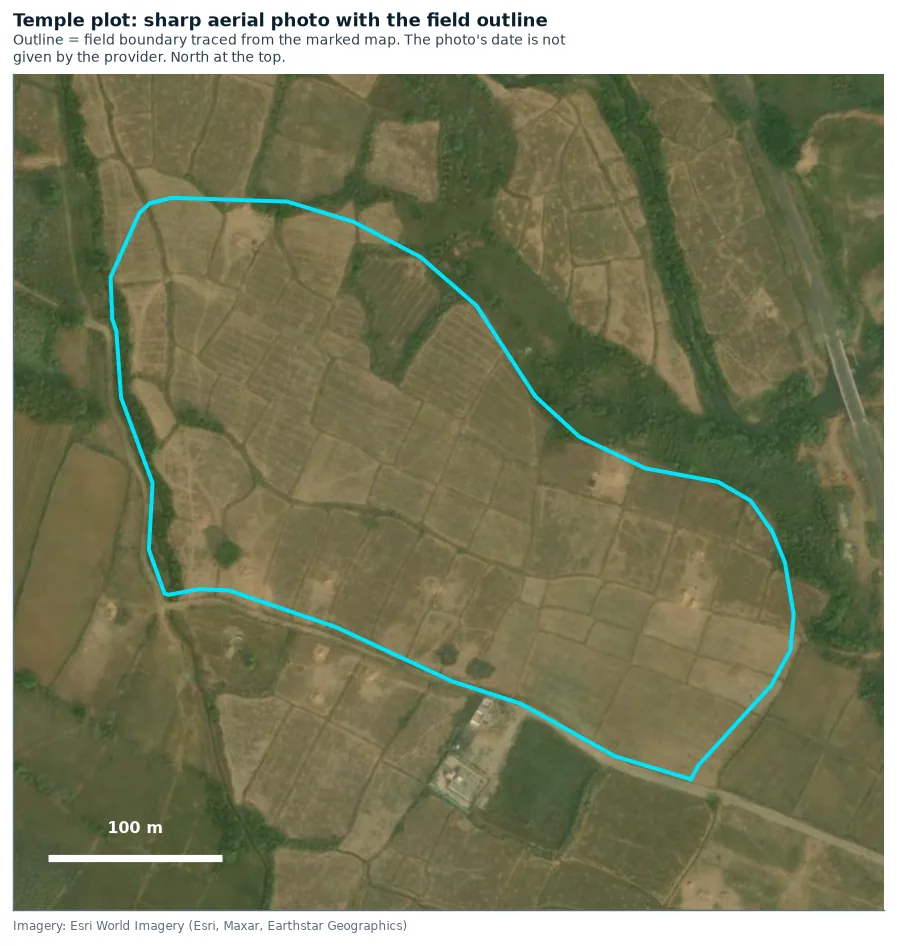
A paddy plot traced from a marked map, opposite the Agnigangamma Temple. This week's advice, satellite photos, greenness maps, the crop's year month by month, a weak-patch check and a soil estimate.
Summary · written 31 Oct 2026 · updated each week
Temple plot at a glance
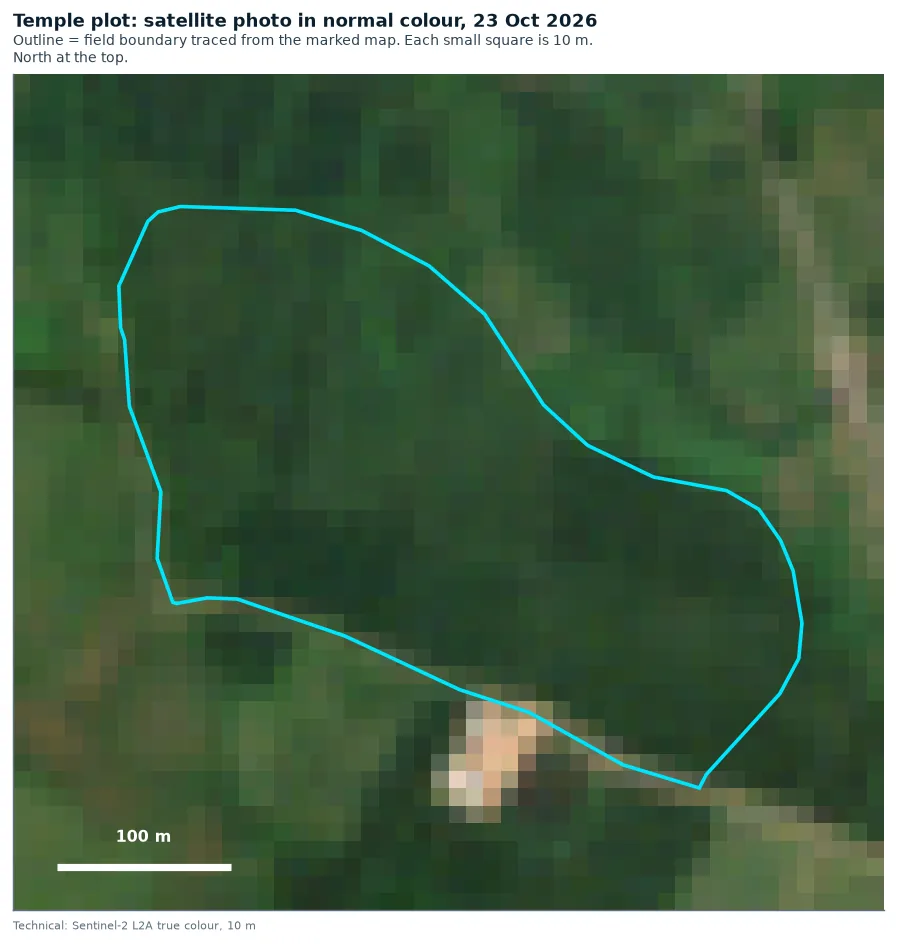
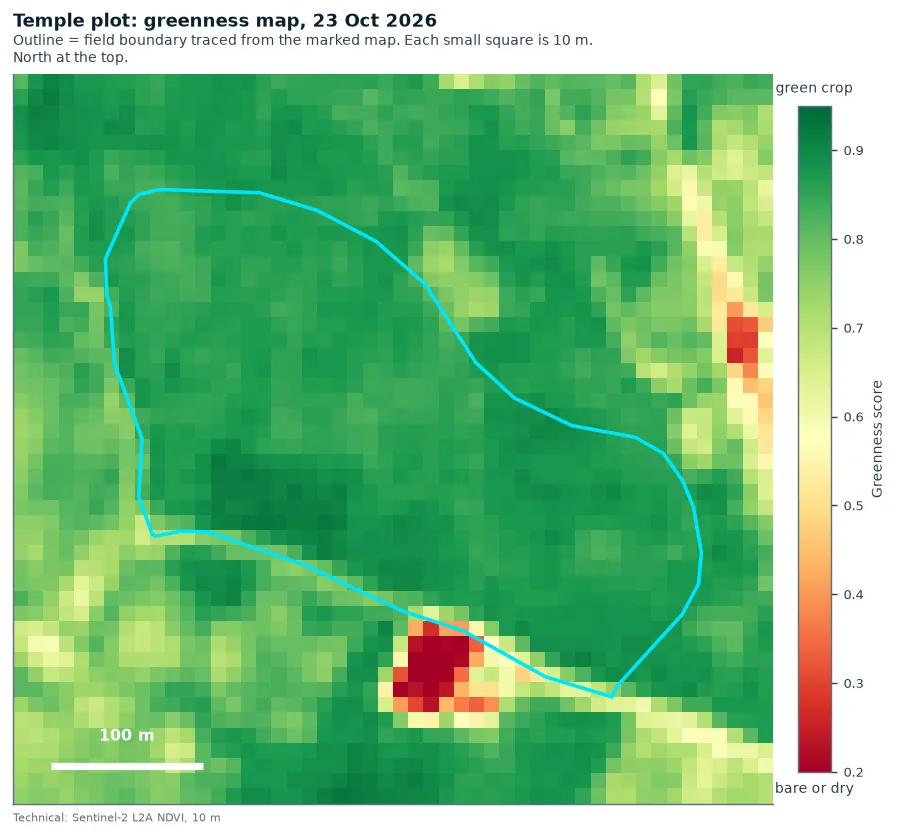
- Crop now. Grain filling / ripening. On the last clear satellite photo (23 Oct) the crop was still fully green (greenness 0.87 out of 1; same week last year 0.82). No sign yet of the field turning golden.
- This week. 29 Oct–4 Nov: keep an eye on blast (a weather check, not a pest count). No heavy rain in the forecast for this plot's spot. The forecast for the other plot, about 1.3 km away, has heavy rain on Wed 4 Nov and Thu 5 Nov; forecasts this close together often differ, so be ready. Action: keep the field outlets ready to open, and look at the neck just below each ear for a grey-brown ring (neck blast). Ask KVK Koraput before any spray. Pest alerts for this plot →
- Harvest. Rough window 15 Nov – 5 Dec (estimate). This plot was planted earlier, so it is likely ready first (mid to late November). Start checking the grain from about 10 Nov; cut when 80–85% of grains are straw-coloured and hard.
- Against last year and the neighbours. In early October the crop was greener than last year (score 1.10; 1.00 = same). Most paddy within 2 km was a little less green than last October. Measured the same way for all fields, this plot scored 1.07 and nearby paddy typically 0.95. So against the neighbours this plot is above them: it did better than about 9 in 10 of them (experimental).
- Weak patch. None found: no part of the plot was clearly less green in both years.
- Water and a winter crop. No known winter water source next to this plot, so there is no winter-water estimate for it. A winter crop here would depend on leftover soil wetness after the paddy (to be confirmed).
- Next for the family. (1) Check for neck blast, and keep the outlets ready in case heavy rain comes. (2) From about 10 Nov check the grain every few days and line up harvest help; the drier days in the forecast are 10 Nov to 13 Nov.
Built from the satellite checks, weather forecast and estimates further down this page. Estimates and experimental checks are marked where they appear below. Trust what you see in the field first. Past weekly reports → · Where to get help (KVK, soil test, crop insurance) →
Pest alerts for this plot · 29 Oct – 4 Nov 2026 · updated 31 Oct 2026
Pest and disease alerts for this plot
Crop stage: grain filling / ripening, from the satellite greenness. No heavy rain in this plot's forecast. Drier days: 10 Nov–13 Nov (4 days). Low = few weather signs. Watch = several signs, look in the field. High = most signs: walk the field this week and look closely.
Untested
Built from published weather rules, not yet checked against pest counts in Koraput. Not a forecast to act on alone; ask KVK Koraput before spraying.
Blast
Watch
4 of 4 weather signs seen (this week): nights 22-28 °C, 5+ days with leaves wet over 10 hours, long very humid spells (60+ hours above 95%), cloudy or drizzly week. Lowered one step because leaf blast matters less once grain is filling (neck blast risk is over by ripening).
Look for: eye-shaped spots with grey centres on the leaves, and a grey-brown ring at the neck just below the ear (neck blast).
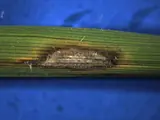 How to spot it →
Yellow stem borer
Low
1 of 5 weather signs seen (previous week): 6-9 sunshine hours a day.
 How to spot it →
Brown planthopper (BPH)
Low
2 of 5 weather signs seen (previous week): average temperature 22-28 °C, average humidity 60-80%.
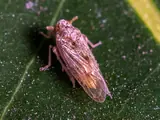 How to spot it →
Sheath blight
Low
2 of 3 weather signs seen (this week): very humid (120+ hours above 85%), rain on 4+ days. Lowered one step because sheath blight is counted lower once the grain is filling (a FarmBot setting, not checked for Koraput).
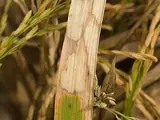 How to spot it →
Bacterial leaf blight (BLB)
Low
1 of 4 weather signs seen (this week): humid (average above 70%).
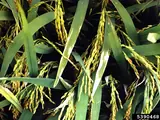 How to spot it →
Leaf folder
Not a risk now
Crop stage is 'grain filling / ripening': leaf folder damage after flowering matters little.
 How to spot it →
Gall midge
Not a risk now
Crop stage is 'grain filling / ripening': gall midge only harms the crop before the ear forms.
photo comingHow to spot it →Coming weeks
- 5 Nov – 11 Nov 2026 (forecast): nothing above low. Crop stage: grain filling / ripening.
- 12 Nov – 15 Nov 2026 (forecast): nothing above low. Crop stage: grain filling / ripening.
These use the weather forecast, so they will change.
Not sure what you are seeing?
Compare with the photos in Spot the pest. Not sure? Take a photo to the KVK: KVK Koraput contacts.
This week's advice is in the next section. The village-wide picture is on Nilabadi pest alerts.
Weekly advice · written 31 Oct 2026
This week: 29 Oct – 4 Nov 2026
Crop stage: grain filling / ripening. Watch: Blast. See the pest alerts for this plot for the reasons.
What to do this week
- Harvest: not yet. The last clear satellite picture (23 Oct) still showed a green crop (greenness 0.87). Rough harvest window 15 Nov–05 Dec (estimate from last year plus radar planting dates; this plot was planted earlier than the Fishing Pond plot, so it is likely ready first). Start checking ears from about 10 Nov: harvest when 80–85% of grains are straw-coloured and hard.
- Storms/wind: if plants fall over, tie 4–5 hills together so ears stay off the water (IMD advice).
- Drier days in the forecast (under 2 mm rain a day), useful for field work: 10 Nov–13 Nov (4 days).
- Keep an eye on Blast (watch): Walk the field and look at the neck just below the ear: a grey-brown ring there (neck blast) makes the ear go white and empty. Also look for eye-shaped spots with grey centres on leaves.
- After harvest: dry grain in the sun to about 14% moisture before storing; 12% if keeping it as seed (NRRI advice).
Weather is a computer forecast (estimate). Pest levels come from the weather, not from insect counts. FarmBot gives no pesticide doses: ask KVK Koraput or the agriculture officer before any spraying.
Official advice to read next:
Where
The exact plot
Traced from the map screenshot you marked. Each screenshot was fitted onto close-up aerial photos by matching roads, ponds and tree clumps, to within about 1 m (how this works). Only 10 m squares whose centre is inside the outline count towards the crop numbers.
| Plot | Centre (map position) | Size | Number of 10 m squares | How sure we are |
|---|---|---|---|---|
| Temple plot | 18.962 N, 83.267 E | 7.47 ha 18.45 acres | 747 (682 fully inside) | Position: sure. Edges: fairly sure (traced from a hand-drawn ring; area could be about 10% off). It may cover more than one person's land. |
Crop health · greenness inside the outline
The crop's year, month by month
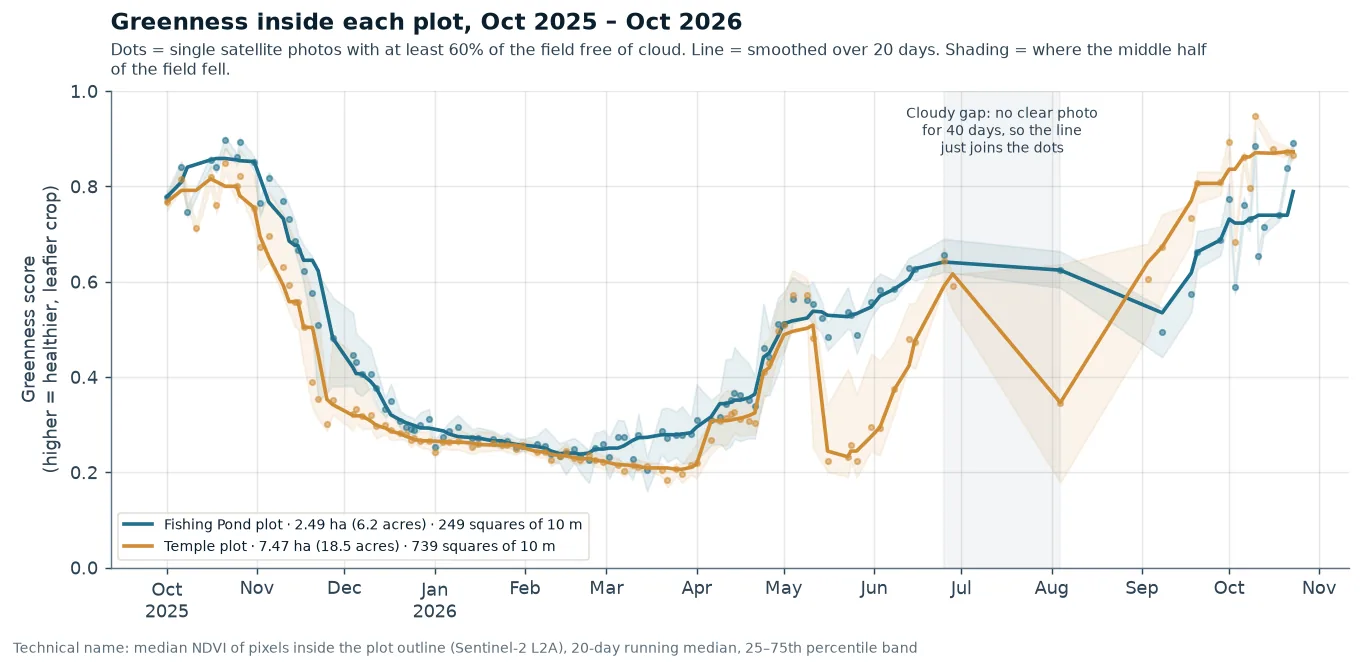
Built from 105 cloud-free satellite photos (at least 60% of the squares inside the outline were clear of cloud). The labels say what the greenness shows. They are not records of work done in the field. Seen by satellite Technical name: NDVI and phenology
25
25
25
26
26
26
26
26
26
26
26
26
26
How to read this: each box is one month, from October 2025 to October 2026. Its colour shows what the field mostly looked like from space that month.
| 2025 monsoon crop at its greenest (smoothed) | 0.82 on about 16 Oct 2025 |
| Ripening started: greenness fell below 0.7 | 2 Nov 2025 |
| Mostly harvested: greenness fell below 0.5 | 22 Nov 2025 |
| Lowest point in the dry season (smoothed) | 0.21 on about 25 Mar 2026 |
| 2026 planting (radar estimate, ±12 days) | around mid-August 2026 (flooded about 12 Aug) |
| September 2026, middle value | 0.73 |
| Latest cloud-free photos | 16 Oct: 0.88, 21 Oct: 0.87, 23 Oct: 0.87 |
| Greenest in 2025 · greenest so far in 2026 (smoothed) | 0.82 · 0.87 |
Harvested or ripening?
Not harvested. On 23 Oct the plot's middle greenness was 0.87, and 100% of its squares scored above 0.6. That is as green as it gets. In 2025 its smoothed greenness fell below 0.7 about 10 days before the Fishing Pond plot.
Radar shows the plot was flooded for planting around 12 Aug 2026 (±12 days). The short green spell in late April and early May 2026 (middle value up to about 0.57) was before that, so it was most likely grass, weeds or a seedling nursery, not this year's crop.
Inside the plot · 10 m squares
Is any part of the plot always weaker? Experimental
Each 10 m square fully inside the outline (leaving out the edge row) is compared with the plot's middle value on the same day. This uses the cloud-free photos of 1–23 October, in both 2025 and 2026. A real weak patch would be low in both years.
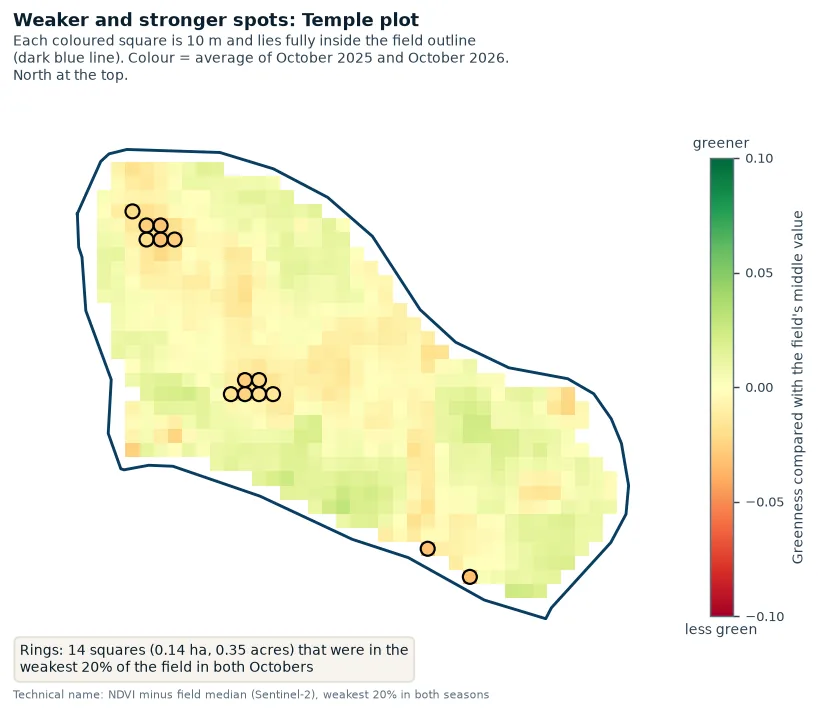
Result: no weak patch
637 squares tested. Only 14 squares (2%) were in the lowest 20% in both years, fewer than the 4% you'd expect by chance. Year-to-year match score: -0.32. So FarmBot does not claim a weak patch. Technical name: weak-zone check with Spearman rank correlation
Soil · from a world soil map
What the soil is probably like Estimate
A slightly sour (acidic) clay-loam (a fairly heavy, sticky soil), with pH 6.2–6.3. (pH 7 is neutral; lower is more sour.) The values are read at one point inside the plot. They come from a world soil map that predicts soil on 250 m squares, much bigger than the fields. Get a Soil Health Card or a lab test before deciding on fertiliser. Technical name: ISRIC SoilGrids 2.0
| What | Top 5 cm | 5–15 cm deep | 15–30 cm deep |
|---|---|---|---|
| Clay (%; sticky, fine particles) | 27.4 | 29.2 | 32.6 |
| Sand (%; gritty, coarse particles) | 39.2 | 37.8 | 35.2 |
| Silt (%; smooth, middle-sized particles) | 33.5 | 33.0 | 32.2 |
| Sourness (pH) (scale 0–14; below 7 is slightly sour, or acidic) | 6.2 | 6.3 | 6.3 |
| Organic matter (carbon) (grams per kg; from rotted plants; more is better) | 28.2 | 17.1 | 11.5 |
| Total nitrogen (grams per kg; a main plant food) | 1.9 | 1.57 | 1.06 |
| Nutrient-holding power (a lab unit, cmol(c)/kg; technical name: CEC) | 19.4 | 17.5 | 17.2 |
| How tightly packed (grams per cm³; technical name: bulk density) | 1.3 | 1.31 | 1.36 |
Please read with care
- FarmBot is an experiment. For now it uses satellites only. Always trust what you see in the field first.
- The field outlines are traced by hand, not surveyed. They were drawn from the maps you marked and lined up with close-up aerial photos (to within about 1–2 m). The edges are right to about 5–10 m.
- The photos are coarse. Each 10 m square is one dot of colour. The Fishing Pond plot holds only about 250 of these squares, and the ones on its edge mix in bunds and the next field. So detail inside a plot is only a rough hint.
- Clouds hide the monsoon. In July and August there were only one or two cloud-free photos. A radar satellite that sees through cloud now gives rough planting dates, good to about ±12 days.
- Soil and weather numbers are computer estimates, not measurements on these fields. Areas are approximate.